Crosstabulation
Table of contents
- Introduction
- Datasets
- Filters
- Weightings
- Variables
- Rows, Columns and 3rd dimension.
- Aggregate statistics
- Display area
- Autorun
- Saving table definitions
Introduction
When analysing survey data, cross tabulation (also called contingency tables) helps to investigate the relationships between two or more variables/questions. For example to compare the answers given by two or more groups (e.g. Men/Women) to another list of choices question.
The Cross tabulation option is available from the and menus in both the Development and Live zones for Survey projects. It is also available for Data projects.
The cross tabulation screen is divided into the panels below:
- Top row: Datasets, Filters, Weightings
- First column: Variables
- Second column: Rows, Columns and 3rd dimension
- Third column: Display area and display options
To return to the main SCROLL menus select Close tabulation in the top right corner of the cross tabulation screen.
Datasets
For Survey projects any of the available data sets can be selected from a drop down menu:
- Survey (live)
- Survey (test)
- Survey (Distribution list)
Select to ensure that the most up to date version of the data is being used.
For Data projects the Uploaded data will be used.
Filters
Filters can be used to select the respondents to be included in tables.
If any filters have been defined they can be chosen from a drop down menu which will display -- None -- at the top of the dropdown list.
Select to add or delete filters.
simple filters
Examples of simple filters are: gender is female, age greater than 65, colour is not blue. A simple filter definition therefore involves a variable, a comparison operator, for example greater than and a value, for example 65 or female.
example 1 - Women only
The example below describes how to define a simple filter to include only women in a table assuming there is a variable called sex with labels Man and Woman.
- Select to open the Manage filters pop up window.
- Enter the filter name in the Filter name text box. For example Women only
- Select Condition to add the first condition. This will display 3 boxes for entering the first condition details.
Variable_name Operator Value
- Variable_name - a drop down list from which the variable to be used in the filter can be selected. In our example we select sex
- Operator - a drop down list from which one of the comparison operators below should be selected. In our example we select ==.
- == equals/is
- != not equal to/is not
- < is less than
- > is greater than
- Value - for a list of choices question this will contain a drop down list from which one of the choices can be selected. For a numeric variable the box will be empty and a number should be entered. In our example we select Woman.
- Select New to save the filter.
The filter will be displayed below the filter definition area.
Finally select x in the top right corner to close the Manage filters window.
The filter will now be available for selection in the Filters: dropdown menu.
Select the filter or select -- None -- from the dropdown menu to run a table with no filters.
more complex filters
Filters using two or more variables can be defined and combined in different ways logically.
example 2 - Women aged 60 or over
- Select to open the Manage filters pop up window.
- Enter the filter name in the Filter name text box. For example Women aged 60 or older
- Enter the condition for women as in example 1.
- Select Condition to add the next condition
- Select age, select (greater than) and enter 59 in the final text box.
- Select New to save the filter.
- Select x in the top right corner to close the Manage filters window.
Note 1: In the display the two conditions are listed under the AND operator. This means that both conditions must be true for respondents to be included in the table. To define a filter to select respondents if either condition is true then the AND can be changed to an OR as follows:
- Select AND operator.
- Select OR from the dropdown menu in the top right corner of the Expression pane. OR will now be displayed above the list of conditions.
Note 2: Conditions and logical operators can be removed from Expressions by selecting the item and then selecting in the top right corner of the Expression pane.
example 3 - Pensionable age (old UK definition)
In this example a filter is defined to select men aged 65 or over OR women aged 60 or over.
- Enter the filter name in the Filter name text box. For example Pensionable age
- Set the logical operator displayed to OR as described in Note 1 above.
- Select Operator twice to add two AND operators.
- Select the first AND operator
- Select Condition twice and then enter the two conditions for Women aged over 59
- Select the second AND operator
- Select Condition twice and then enter the two conditions for Men aged over 64
Note: The filter expression is displayed as a tree to which new branches are added when using Condition or Operator to add new items. When adding conditions and operators make sure that you first select the part of the tree below which the new item should be added by selecting the appropriate AND/OR operator.
Users with programming/maths experience may like to think of AND and OR as functions to understand the tree like display. So example 3 could be thought of as:
OR (AND(sex == Woman,age > 59),AND(sex == Man,age > 64))
Where:
- AND(a,b,c,d) is true if conditions a,b,c and d are all true.
- OR(a,b,c,d) is true if one of the conditions a,b,c or d is true.
- OR(AND(a,b),AND(c,d)) is true if either a and b are both true or c and d are both true.
Weightings
If weights have been defined for the data set they will be available from the drop down menu here.
In a weighted table the cells of a table show the total of the weights for individuals in that cell rather than a count of the individuals in that cell. Weights are usually used to adjust results when the characteristics of the respondents (e.g. age/sex/region) differ from the characteristics of the population the respondents are supposed to represent. For example if there is a higher proportion of older female respondents than expected.
Variables
The list of survey variables is shown in this area. Hover over the variable name to see the variable details - for example question text and type of variable. Lists of choices, Integer and Decimal questions can be used in tables.
List of choices questions
List of choices questions can be used as the rows, columns and the 3rd dimension of tables. Select a list of choices question and a Modalities section will appear displaying all the possible answers (categories) for that variable.
Note that these categories can be grouped together to form a row (or column) of the table. For example suppose we want to group months into quarters in a table:
- Select variable month to display the list of months.
- Use CTRL select to select January-March.
- A checkbox, as group, will be displayed in the bottom of the pane.
- select the check box and a text box will open.
- Type Quarter 1 into the text box.
- Now drag the selected months into the rows (or columns) area of the table.
A Quarter 1 row (or column) will be added to the table. Repeat for Quarters 2-4.
Numeric questions (Integer/Decimal)
Numeric variables can only be used as the rows/columns of tables if they are defined as integer range variables (minimum and maximum specified) and have 100 or fewer values in the range. See Aggregate statistics below for use of numeric variables in tables.
Note that there is an example in the Data projects section showing how a numeric variable can be used to derive a list of choices variable for use in tables. For example to convert age into age groups. Click here to go to the example.
Rows, Columns and 3rd dimension.
Variables should be dragged and dropped into the Rows and Columns sections to define the rows and columns of the table.
More than one variable can be dragged into each of the sections to produce concatenated tables. So, for example, the first set of rows of the table could show results for one variable and the second set of rows show results for a second variable in the Rows section.
Variables can be dragged out of the Rows/Columns and returned to the Variables section. They can also be removed from tables using the icons.
A third dimension can be added to the table by dragging a variable into the 3rd section (below Rows and Columns) and selecting from the drop down menu options to control how the third variables should be used.
For example, suppose we define a table with a variable region for the rows and age_group for the columns to count the numbers of people in each age group in each region. If variable sex with categories woman and man is then dragged into the 3rd dimension box then the results produced for each dropdown choice are shown below:
- Pages - 2 tables are produced - one for women and one for men.
- Rows - for each region there will be a row for women and a row for men as well as the total (Base) for the region. (sex nested within region)
- Columns - for each age group there will be a column for men and a column for women as well as the total (Base) for the age group. (sex nested within agegroup)
Aggregate statistics
Summary statistics for numeric variables can be displayed in the cells of tables.
Select a numeric variable in the Variables pane. This will display the available statistics in the Measures pane under the variables pane. Drag one or more of the statistics listed in the Measures pane to the Aggregates pane at the bottom of the second column.
The statistics available are:
- Average - average/mean
- Std. Dev. - standard deviation
- Min. - minimum value
- Max. - maximum value
- Sum - total
Display area
The display area is where the table is displayed. The results can be displayed as tables of numbers or in chart form.
Select Tables to display in table form.
Select Charts to display in chart form.
Note that not all tables are suitable for presentation in chart form.
There are menus at the top of the display area. The display and output options available from the Tables menus are described below:
Measures menu: Select what should be displayed in table cells
Select one or more options from:
- Frequency - show counts
- V. percentage - show percentages based on column totals
- H. percentage - show percentages based on row totals
Significance menu: Test for associations between variables
The options available from this menu are only valid when the respondents can be considered as a representative random sample.
It highlights cells where differences in percentages are significantly larger than would be expected if there were no differences between groups in terms of a particular characteristic. For example to test a hypothesis of the form Men and women do not differ significantly in terms of their response to a particular question. So the responses to that question are independent of gender.
If cells are highlighted it means that this (null) hypothesis is unlikely to be true given the percentages so it is likely that there are differences between the groups. large and small percentages are highlighted. So for example if the columns of a table are Men and Women and column percentages are displayed then if a cell is highlighted with green for women then it means women are significantly more likely to have chosen that row option than men.
How strict the test is can be controlled by choosing the confidence level. The higher the confidence level chosen the larger the differences have to be to be considered significant.
Select one of:
- Test (indep.) 90% - Test independence with confidence level 90%
- Test (indep.) 95% - Test independence with confidence level 95%
- Test (indep.) 99% - Test independence with confidence level 99%
Totals menu: Define how row and column totals should be calculated and displayed.
Choose from the following options
- Include rejects - add extra row and column to show numbers of respondents who have no value for a variable.
- Automatic filters - Feature not available yet.
- Show totals - choose whether row/column totals should be displayed.
- Tot label - a text box to change the label to be used for totals.The default text is Base
- Tot. pos- the position of the total rows and columns. Select from:
- First - display at the beginning of the rows/columns.
- Last - display at the end of the rows/columns.
Display menu (Tables): Additional display options - choose from:
- Horizontal row heading - choose whether to display the row heading above the row labels or in an extra column to the left of the row labels.
- Show empty lines choose whether to suppress the display of rows or columns where counts are 0.
- Unweighted frequencies - for weighted tables choose whether to display unweighted frequencies.
Example table with vertical percentages (V%):
| Base | What is your employment status? | |||||||||||||
|---|---|---|---|---|---|---|---|---|---|---|---|---|---|---|
| Employed full time | Employed part time (<25hrs a week) | Self-employed / freelance / Independent | Student | Retired | Unwaged | |||||||||
| N | V% | N | V% | N | V% | N | V% | N | V% | N | V% | N | V% | |
| Base | 247 | 100.0 | 149 | 100.0 | 23 | 100.0 | 49 | 100.0 | 14 | 100.0 | 7 | 100.0 | 5 | 100.0 |
| In the past 12 months have you received any training in research methods or techniques? | ||||||||||||||
| Yes | 154 | 62.3 | 98 | 65.8 | 14 | 60.9 | 26 | 53.1 | 13 | 92.9 | 1 | 14.3 | 2 | 40.0 |
| No | 90 | 36.4 | 50 | 33.6 | 9 | 39.1 | 22 | 44.9 | 1 | 7.1 | 5 | 71.4 | 3 | 60.0 |
| Not sure | 3 | 1.2 | 1 | 0.7 | 0 | 0.0 | 1 | 2.0 | 0 | 0.0 | 1 | 14.3 | 0 | 0.0 |
Export menu (Tables): Export table for use in other software. Choose from formats below:
- HTML - HTML format for display in browsers or cutting and pasting into other software.
- CSV - a delimited text file . Separator is semi-colon ;
- XLS - a Microsoft Excel file.
The display and output options available from the Charts menus are described below:
Display menu (Charts): What sort of chart to display.
For one dimensional tables (i.e. no row or no column defined) a pie chart is shown by default. The display menu has only one option:
- Horizonal bars - to display a horizontal bar chart.
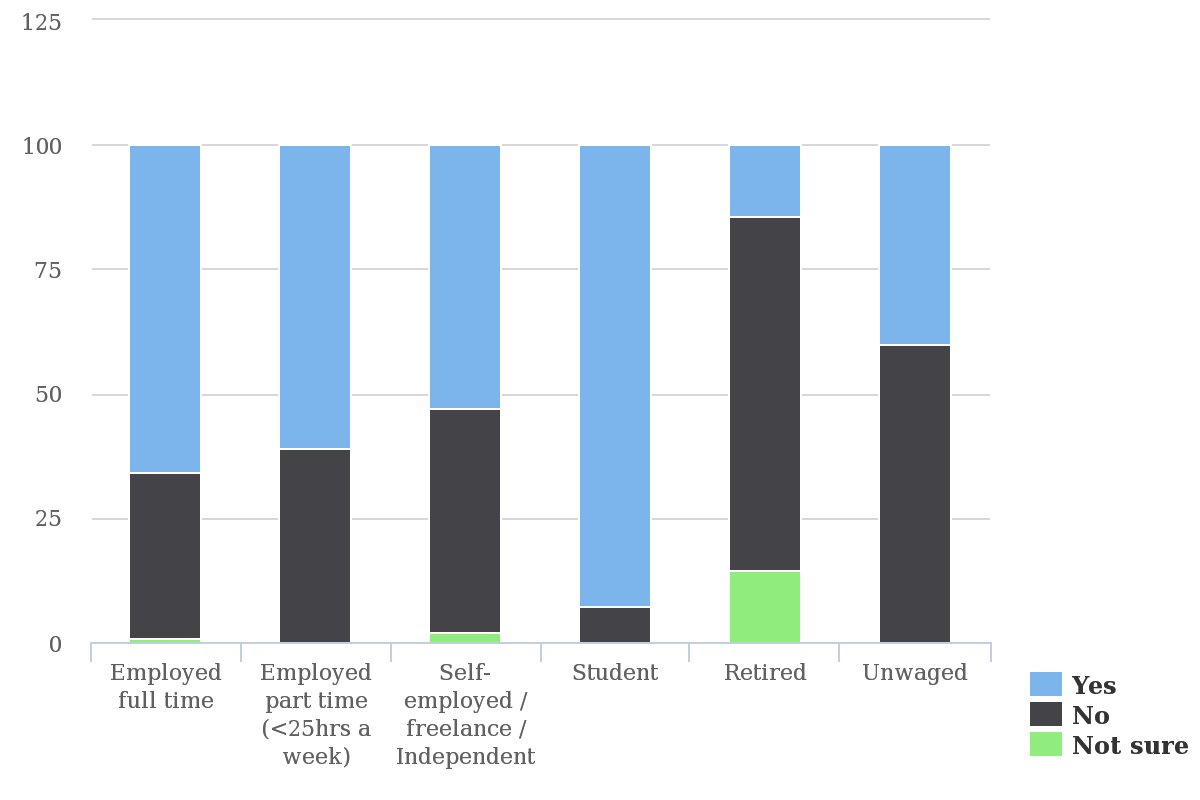
For two dimensional tables a vertical bar chart is displayed by default. A different colour is used for each choice/category of the variable used for the table rows. A set of bars is shown for each choice of the variable used for the table columns.
The default can be changed by selecting one of the display options below:
- Horizontal bars - to display a horizontal bar chart.
- Stacked bars - to display a stacked bar chart. One bar for each category/choice in the column variable.
- Lines - use joined up lines instead of bars. Particularly suitable for when the column variable has time period categories - month, quarter, year etc.
Example Chart based on table above with stacked bars.
In the past 12 months have you received any training in research methods or techniques?
Export menu (Charts):
The Chart Export menu has the following options:
- Print - to print the chart.
- PNG - to download an image of the chart in png format.
- SVG - to download and SVG version of the file. SVG is an XML-based vector image format.
- PDF - to download as a pdf document.
Autorun
autorun - select autorun for tables to be updated automatically as each component of the table is added.
Unchecking autorun will display the button which can be used to update the table based on the latest settings.
Saving table definitions
Once a table has been created the table definition can be saved and given a name using the Table definition function. The same table can then be more easily rerun at a later date. For example to update the table after new data added.
Select in the top right corner of the display area to open the Table definition screen.
The Table definitions screen is divided into 2 areas:
- Saved definitions - a list of table definitions already saved.
- Save current table - for naming and saving the current table definition.
If no tables have been saved then the Saved definitions area will not be displayed.
Save current table
- Enter a name for the definition in the Name: text entry box.
- Select and you should get a message to say Request saved successfully.
- Select to return to the main Cross tabulation screen.
Saved definitions
This area will the lists the names and dates of creation for any saved table definitions.
You can select a definition and then or the saved definition.
Loading a definition will close the Table definitions screen and the table will be updated using the latest data and displayed.