Survey projects
Table of contents
Getting started
Survey development
- DASHBOARD - main indicators and shortcuts to the survey
- EDIT - Create the questionnaire
- Survey questions: enter the question definitions
- Survey routing: define the order in which questions are asked and specify any conditions that determine whether a question should be asked
- Survey scripting: use the CAWI scripting language
- Import questionnaire: Upload Microsoft® Word questionnaire document or Unicom® Intelligence metadata document (mdd).
- Survey quotas: define quotas
- Add to library: this is where you can find all the questions you frequently use (and have added to the library)
- Manage images: upload images used on the survey
- File manager : access the resource files used for the project
- DEPLOY - Specific to CAPI fieldworks
- Distribution list - list of contact (households or individuals) to be invited to complete the survey
- Manage CAPI - status of the contact allocations
- Respondents - present the status of the questionnaire for each contact (household or individual)
- Interviewers - present each interviewer's allocated contacts along with their statuses
- CAPI reports - displays customized tables to monitor the fieldwork
- EMAILING - Specific to CAWI fieldworks
- Distribution list - list of contact (households or individuals) to be invited to complete the survey
- Deploy options - list of deployment options
- Email campaigns- set up an email campaign
- SURVEY RESULTS
- Summary counts - display the results of the survey (showing frequencies and percentages for all questions)
- Survey activity - monitor survey connections
- Connection statistics - display the number of interviewees who have validated the page, regardless the date (with daily details available)
- Browse responses - list all responses to the survey
- Cross tabulation - create summary tables from the survey responses
- Saved tables - display tables created in the cross-tabulation section
- Export data - export the survey data for analysis in other systems
- Import data - import data into the project (Experimental feature in development)
Getting started
Survey projects are used to:
- Develop and test questionnaires
- Manage CAPI fieldwork
- Send email invitations to respondents
- Monitor progress and send reminders
- Analyse survey responses
- Export survey data for analysis in other systems
After logging in (and selecting a SCROLL account if necessary), any existing survey projects will be listed on the Survey projects screen.
Options on the Survey projects screen
- Select a survey to work on using the Survey column.
- Delete a survey by using
- Create a new Survey Project.
- Create a new Data project
- Add/remove/edit users: refer to Account User Administration
Creating a new Survey project
Use to create a new survey project and enter the following details:
- Survey type
- New survey
- Copy of an existing survey
- Link to an existing CAWI project
If the second option is chosen, a dropdown menu will list all the existing projects with the following options available to copy: * Questions and layout * Questions only * Layout only
- Survey URL - provides a preview of the URL based on the identifier you choose in the next step.
- Survey identifier - a short identifier for the project, such as "mysurvey" or "feedback2018". It must start with a letter and only contain letters, digits or the "_" or "-" characters. This identifier will be part of the web address (URL) for the published survey and must be unique for each project in the account.
- Survey title the name of the survey, displayed at the top of every page of the questionnaire.
- Layout - choose from the following options : specific client layout, Scroll layout, no layout.
Once a new survey project has been created, the identifier cannot be changed. However, the title can be modified on the Survey settings page.
Once the details have been entered, click on the to create the new survey project and navigate to the main project page.
Project User administration
The list of Survey users is displayed at the bottom of the main project page. When a project is first created, this list is imported from the account users. Access rights for existing users can be modified here and new users can be added. See Project User administration for more details.
Survey Development
This is the primary area for developing and testing questionnaires, as well as managing survey processes like emailing and monitoring.
The top level menu in the Survey Development Menu includes the activity areas listed below. These can be selected in SCROLL to display submenus covering the various activities involved in developing surveys.
A brief description of the activities available in each area is provided below. Click on the activity name for more detailed information:
- DASHBOARD: main indicators and shortcuts to the survey
- EDIT: create and modify the questionnaire
- DEPLOY: manage the distribution list, allocations, email links to the questionnaire
- SURVEY RESULTS: check, analyse and export the data
- SURVEY SETTINGS: define survey settings, including title, language, question numbering, PDF creation)
- SURVEY USERS: list users with access to the project and their permissions
DASHBOARD : Main indicators and shortcuts to the survey
The Dashboard menu present key information about the survey, including :
- the number of contacts in the Distribution List
- the number of people who have connected to the survey
- the number of people who have completed the survey
- the number of people included in the export (regardless of whether they have completed the survey)
It also provides shortcuts to the following sections : Distribution List, the Survey Activity section, the Summary counts and the Export data.

EDIT : Creating the questionnaire
Menu items - select a menu item for detailed notes:
- Survey questions: enter the question definitions
- Survey routing: define the order of questions and any the conditions that determine if a question should be asked
- Survey scripting: use the CAWI scripting language
- Import questionnaire: Upload Microsoft® Word questionnaire document or Unicom® Intelligence metadata document (mdd)
- Survey quotas: define quotas for the survey
- Manage images: upload images used in the survey
- File manager : access the resource files used for the project
Survey questions
The Survey questions screen has two areas for entering question definition information:
- Survey questions - add or modify question definitions
- Shared lists - define response types to be used across multiple questions.
As definitions are added, the new questions and lists will be displayed in tables within these two sections.
Use the to download a PDF version of the questionnaire.
Use the to download a Word version of the questionnaire.
Adding/modifying questions
Use to create a new question. This will display the New question screen.
Use in the Actions column of the list of questions table to edit the properties of an existing question. This will display the Edit question screen.
Defining question properties in the New question and Edit question screens is described in Adding and Editing Questions. Defining question properties in the New question and Edit question screens is described in Adding and Editing Questions.
Use in the Actions column to delete a question.
marks variables that will be pre-populated with data from the Distribution lists when SCROLL's email invitations are used. See Emailing.
Shared lists
Shared lists are lists of choices available for use in more than one question. Once defined they are available from a drop down menu when defining response types when Adding and Editing Questions.
Use to open the New list screen.
Information to be entered:
- identifier - the name of the new list. This is the name that will be displayed as an option whenever a list of choices question is being defined. Names allowed follow the same rules as question identifiers
- Label (optional) - A description of the list. For example "Satisfaction scale to be used in 2018". This text is not displayed to respondents.
- Labels and properties - defined in the same way as when defining a list of choices question.
New shared lists can also be created when Adding and Editing Questions. Whenever a new list of choices is added there is an option to save the list as a shared list.
Question order
By default on new projects all questions are asked and asked in the order they are defined on the Survey questions page. This is referred to as automatic routing mode. In automatic routing mode the order questions are asked can be changed by using to drag questions up and down. Each question is presented to respondents on a new screen.
For more control over the routing see Survey routing below.
Survey routing
Routing is the term used to describe the order questions are asked and the conditions, if any, for asking each question. For example if there are different sets of questions for women and men.
As described above new projects start in automatic routing mode. For more control over the routing select Survey routing and use
Note that once manual routing is enabled then changing the order that questions are listed on the Survey questions page will have no effect on the order questions are asked.
Manual routing mode
On the Survey routing screen when is selected the questions are listed in the order they will be asked. In addition page breaks are shown to indicate which questions are displayed to respondents on each page of the survey. In SCROLL each screen presented to respondents when completing the questionnaire is referred to as a page. More than one question can be displayed on each page
Use to drag questions up and down to alter the order that questions are asked. can also be used to drag questions inside the page breaks so that more than one question can be displayed on each page.
The options available for each page are:
- - add a condition around the page to control whether the page is displayed to the respondent.
- - add a message to the page
- - insert a new page. For example to add a new page just containing an information message
- - delete a page. When a question is moved to another page it may leave an empty page which would be presented as a blank screen to respondents.
The options available for each question are:
- - edit the question. Opens the Edit question screen
- - remove question from the route.
Conditions
Whether a question is asked of respondents can be made to depend on previous answers they have given. Selecting for a page will bring up the Condition definition menu to be used to define the rules for displaying the questions on that page.
Example conditions : gender is female, age greater than 16, brand_used answered, colour is not red or blue.
The first 2 components of the condition are defined using drop down menus.
- ------ Select response to filter on: ------: - select a question
- ------ Choose a test: ------: select the type of rule that the responses to the selected question must satisfy.
Once the type of rule has been selected then, if applicable, the response values that the question will be checked against can be specified. For example by selecting from a list of choices or entering a numeric value.
Rules available for both lists of choices and numeric questions
- is...
- is not...
- has an answer
- does not have an answer
Additional rules provided for numeric questions
- is greater than
- is less than
- is greater than or equal to
- is less than or equal to
Use to edit a condition once defined and saved.
Use to remove a condition.
Use to drag conditions up and down and to drag pages in or out of the scope of a condition.
Conditions can be nested so that all pages within the scope of multiple conditions will only be displayed if all those conditions are satisfied. So for example conditions can be defined such that a set of questions are asked of women only and then a subset of those questions asked only of pregnant women.
Remove question from the route
When a question is removed from the route with it will be moved to the Questions not in survey area at the bottom of the screen. The question will not be presented to respondents but may still contain answers - for example with values read in from the distribution list. The question can be dragged and dropped back into a page on the route by using .
Messages
Text messages can be added to each page to display information to respondents. For example "The next set of questions are about your most recent holiday". When is selected for a page then a text entry box appears for the message to be typed into.
There is a drop down box to select whether the message should be displayed with the normal style or a selection of heading styles (for example large font and bold). These styles can be different for different projects so try the different styles to see which works best.
Survey scripting
This option is for advanced users and is not available in all accounts. Changes to the questionnaire can be made using the underlying Survey scripting language. A text editor window will open to enable changes to be made.
Use to save the changes. If there is a syntax error in the changes made then an Error message window will pop up with details about the error.
Use to undo changes and revert to the last successfully saved version.
Import questionnaire
This option can be used to import a Microsoft® Word questionnaire document or a Unicom® Intelligence metadata document (mdd).
To import a document:
- Select
Locate the file to be uploaded (by default, only .docx and/or .mdd files are shown; the dropdown menu can be used to show all files).
Select Open and to load the file into SCROLL.
The message Your questionnaire has been imported successfully. should appear at the top of the screen.
If SCROLL is unable to convert the document then an error message will be displayed.
About Microsoft® Word documents
For a Word document to be loaded into SCROLL the questions must be defined using certain conventions and custom styles. Custom styles are used to mark the question components. (See Word documentation and online sources for information about custom styles.)
A complete marked up Example questionnaire (.docx) can be downloaded by clicking here. It contains the custom styles available and describes how to define and mark up different types of question. Download French version by clicking here.
A Template file (.dotx) file can also be downloaded to use the custom styles in a Word document. Click here to download.
The files can also be downloaded from the Import questionnaire page in SCROLL by clicking the documents listed under Example Word documents
Question names, text, types and settings are marked up using the following styles which are described in the template file referred to above:
- s10QTEXT
- s11QTEXTREC
- s20CHOICE
- s30QTYPE
- s50INST
- s60SETTINGS
- s70MESSAGE
- s80NEWPAGE
- s81ENDPAGE
The name and text are defined with style s10QTEXT (or s11QTEXTREC if it is a question of type RECODE.) The question text may be associated with an instruction, identified with the style s50INST. Question type, attributes and parameters are defined using the style s30QTYPE. A message is defined with style s70MESSAGE.
See the download files
Survey settings
Selecting this menu item in SCROLL will open up a screen in which the survey features listed below can be controlled/modified.
- Project title - the title of the project that by default will be displayed on the top of each page of the interview.
- Project notes - an optional text box useful for recording shared notes about the project. Not displayed in the interview.
- Survey language - the language for built-in survey error messages. A dropdown box can be used to select the language.
- Show question numbers in survey. Select from:
- no - the default option.
- yes - question identifiers are displayed before the question text.
- yes - convert to numbers. The sequence number of the question is generated and displayed.
- Tracked respondents can resume interview. Select from:
- Always - respondents using a personalised survey link ("tracked") can return after all questions have been answered. See emailing.
- Only if incomplete - only allow for partially completed interviews.
- Enable PDF download. Select from:
- no - the default option.
- yes - add a link on the survey thank you page to allow a respondent to download a PDF file containing their responses to the survey.
- Completed text - a text box to enter that text that appears when the respondent has already completed the survey and is not allowed to return.
The default text for the last option is:
<h1>Survey already completed</h1>
<p>You've already completed and submitted this survey.</p>
As shown in this example HTML code can be used in the text boxes on the survey settings page to control the display. This text above will be displayed as below (assuming default SCROLL gds css styles used) :
Survey already completed
You've already completed and submitted this survey.
Survey quotas
Setting quotas gives control over the numbers of interviews obtained from respondents matching certain criteria. An example quota scheme involving three quota groups is shown below.
| Target | |
| Global: Number complete | 1000 |
| QAge: Quota for Age group | Target |
| 18-34 years (age_group=1) | 200 |
| 35-54 years (age_group=2) | 400 |
| 55-65 years (age_group=3) | 200 |
| More than 65 years (age_group=4) | 200 |
| QSex: Quota for Gender | Target |
| Male (Sex=1) | 400 |
| Female (Sex=2) | 600 |
In this example, we want to collect 1000 completed interviews but also ensure that we interview 600 women and 400 men and preset numbers in each age group. The table shows quota groups called Global, QAge and QSex.
We achieve this by setting quota targets and keeping a record of how many interviews have been achieved with respondents having the characteristics associated with the quota groups. For each new potential respondent the quota system can check the quota target cells corresponding to that respondent's characteristics and close the interview if one (or all) of those cells is already full.
The quota cells a respondent is associated with may be based on their responses to questions, for example age and gender. Respondents can also be assigned to quota group cells, for example to allocate people to different groups to control the numbers to be asked different sets of questions.
The underlying components of the quota system in The CAWI System are described in the Quota Management section. The next section describes how quota groups can be created using SCROLL.
Quota Definition
Determine the quota qroups you wish to create and use the question editor to add CHOICE questions to match your criteria.
For example, to set quota targets based on gender and age group then questions must first be defined in your survey with response lists that exactly match the criteria in each of the quota groups.
Select the survey quotas menu item to define your quota group(s)
This will bring up the Survey quotas screen. To add a quota group click on to bring up the New quota screen.
Enter a name for the quota group and optional description in the first two text boxes. The name can reflect the variables used to define the quota group. For example Q_AgeSex for a quota group based on different Age group/Gender combinations. This name will be used in the quota report.
Four drop down menus can be used to select the variables to be used for the quota group. This is to allow for quotas based on combinations of variables to be defined. For example a quota for each age group/gender combination would use the first two drop down lists. Quotas based on single variables should be defined as separate quota groups, selecting one variable from the first of the four drop down lists for each quota group.
If no variables are selected then a global quota group will be created. This can be used to control the total number of interviews to be achieved.
Click on to create the quota group. Click on to cancel the quota defintion.
These buttons will return you to the Survey quotas screen from where you should enter the quota targets and, if necessary, add more quota groups.
Edit the quota group to enter the target numbers that you require in each criteria.
Click on the symbol and enter the target numbers against each response category or combination of response categories.
Quota groups can be deleted using the button below the quota definition.
Quota Control
Quota control rules can only be added using survey scripting as described in Quota Management.
In summary the steps involved are:
Add code to the survey routing to ensure variables used in quota groups are given values .
This may be through asking questions directly or by deriving values through calculations. For example you may already be asking for actual age but need to derive an age group variable to be used for quota control.
Add code to the survey routing to call the quota control functions, as required.
Controlling the number of respondents collected involves requesting the SCROLL interview system to keep track of how many respondents have already completed interviews for your quota criteria and determining whether the interview for a particular respondent is required or not. This is done by calling the quota control functions at the correct places in the survey routing.
Add to library
In this section, you will find all the questions you have added to your library - those that you frequently use.
Manage images
Use this section to upload images that you want to include in your survey.
File manager
This menu item is for advanced users and is not available in all accounts. It provides direct access to the underlying components used for the questionnaire and how it is displayed.
These components are described in Structure of the CAWI. A summary of the different components, which are grouped into five tables, is shown below:
- project_id.dsc: The DSC file which defines the questionnaire in the Survey scripting language.
- project_id.ini: The project ini file which sets various survey options
- project_id.docs: css code, js code, logos, images and videos.
- project_id.rsc: HTML files to define the layout of questionnaire/survey pages
- project_id.print: to be documented
Advances users and SCROLL support staff can use these components to implement features not directly available through the SCROLL interface.
The following operations are available:
- to access the file system to locate files for uploading into SCROLL.
- to upload selected file(s)
- to delete a file (some files cannot be deleted)
- to download a file
- to view a file
- to edit a file (text files only)
DEPLOY: Manage your CAPI fieldwork (specific to face-to-face interviews)
Menu items - select a menu item for detailed notes :
- Distribution list - list of contacts (households or individuals) to be invited to complete the survey
- Manage CAPI - status of contact allocations
- Respondents - status of the questionnaire for each contact (household or individual)
- Interviewers - present for each interviewer his allocated contacts and their statuses
- CAPI reports - displays tailored tables to monitor the fieldwork
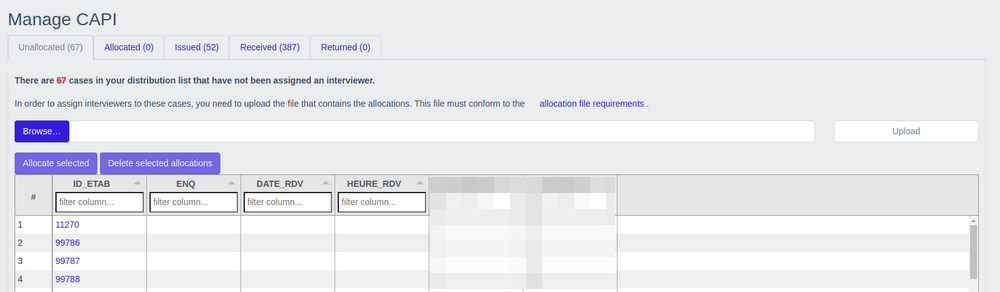
Manage CAPI
This section allows you to manage the allocation of interviewers to the contacts on your distribution list.
The table includes several tabs, each representing a different status of the contacts as they progress through the fieldwork :
- Unallocated - the contact has not been assigned to any interviewer
- Allocated - the contact has been assigned to an interviewer
- Issued - the contact is assigned and available for the interviewer to download onto their tablet
- Received - the contact is now on the interviewers' tablet
- Returned - the contact has been returned to the system (e.g.: for reallocation to a different interviewer or to resolve data issues etc)
Note:
- if you have only a few allocations to make, you can assign contacts to interviewers one by one
- for larger lists, it is more efficient to upload a CSV file with two columns: the contact ID and the interviewer code (ensure the column title match the existing names in SCROLL). You can then upload this file in the Unallocated tab.
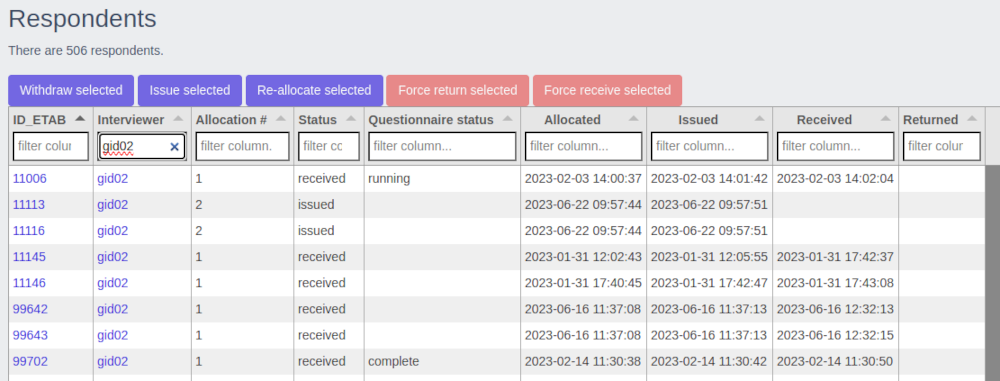
Respondents
This section provides various details about a single respondent (contact) of the survey.
Most of the time, you will find the following information:
- The ID of the respondent
- The assigned interviewer
- The number of assignments - track the different interviewers if the respondent's assignment has changed from the initial allocation
- The status of the contact - indicates whether the contact has been issued, received or returned
- The status of the questionnaire - shows if it is running, complete or screenout
- Dates of the contact's status change (from allocated / Issued / Received / Returned)
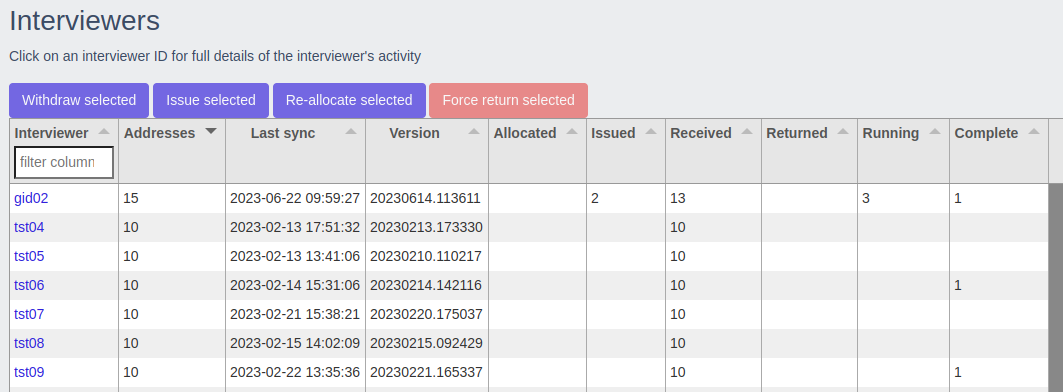
Interviewers
This section provides various details about the survey interviewers. You can view a table listing all interviewers or focus on the details of a specific interviewer.
Most of the time, you will find the following information:
- The ID of the interviewer
- The number of contacts assigned to the interviewer
- The last time the interviewer synchronised his tablet / device
- The version of the questionnaire on the interviewer's tablet (to ensure it is the latest version)
- The distribution of contacts : indicated whether the contact has been allocated / Issued / Received / Returned
- The status of the questionnaires : shows whether they are Running, Complete or Screenout
Here is how the information can be illustrated with an example, see the image below
- If we take the first interviewer : gid02
- He has 15 contacts allocated to him
- He synchronized his tablet on June 22nd 2023, at 9h59
- The version of the questionnaire on his tablet was deployed on June 14th 2023 at 11h36
- He has 2 addresses waiting to be downloaded on his tablet, 13 addresses received and 0 addresses returned
- among the 13 contacts received on his tablet, he has 3 questionnaires started and 1 completed
CAPI reports
This can be used to display tailored tables to follow the fieldwork.
EMAILING: Manage your CAWI fieldwork (specific to online interviews)
Menu items - select menu item for detailed notes.
- Distribution list - list of people to be invited to complete the survey
- Deploy options - list of deployment options
- Emailing - set up an email campaign
Distribution list
The distribution list is the pool of potential respondents to your survey. SCROLL can be used to send email invitations or else you can generate a list of random tokens which can then be downloaded and used in your own systems.
If using your own systems to send out URL links to the survey in email invitations then tokens should be used if you wish to be able to track respondents. Tracking allows respondents who have completed the survey to be excluded from reminder emailings and enables questionnaire data to be linked back to individuals.
There are separate distribution lists in the development and live zones, but they must both consist of the same set of variables. The distribution list in the development zone is for test respondents. The notes below apply to both zones.
At a minimum the distribution list must contain email addresses but can also include extra data items (referred to in SCROLL as variables) which can be used to customise the content of emails and/or linked to the survey responses. For example it could contain responses to a previous wave of a panel survey.
Topics in this section:
- The data table - Display of the data in the distribution list.
- Upload an external file(s) - Add data to the distribution list.
- Pre-populate survey - Pre-populate the survey with distribution list variables.
- Add/Update records - Add/Update records in the distribution list.
- Copy from a SCROLL data project - Copy data from a SCROLL data project.
- Generate tokens - Generate the tokens to be track respondents.
- Manage variables - Provide more detailed descriptions of imported variable.
- Define a filter - Define a subset of the list to be used to select respondents for emailing.
The Data table:
Data in the distribution list is displayed in a data table. Various actions can be performed:
- Delete all or Delete only selected records. Use in the first column of the table to select all or some of the records.
- Use Show to control the number of records displayed on each page
- Use Previous and Next to move between pages when records are displayed on more than one page.
- Horizontal scroll when all variable columns cannot be displayed on one screen
- Sort the data according to the values of one of the variable names.
- Download the data as a csv file.
- Show response status and emailing information
Upload an external file:
Use to go to the file upload screen to select external file(s).
The following formats can be uploaded:
- Excel - XLSX only
- CSV
- Zipped CSV file - zip file containing one or more .csv files
- SCROLL bundle - a combined file containing a CSV file and SCROLL DSC file, using the .scroll extension
For both CSV and Excel files, the first row should contain the names of the variables in the data. These should follow SCROLL's conventions for question identifiers.
Use to open up a screen to locate and select the file or files to be uploaded.
More than one file can be uploaded. The files will be listed as they are uploaded and a drop down menu can be used if different encoding needed to handle non Western European characters. For example Arabic, Chinese, Cyrillic, Greek or Japanese.
Use to confirm the selection and import the data into SCROLL.
Pre-populate the survey with distribution list variables.
Any variables defined in the distribution list can be included in the main survey as described in the Manage variables section. When linking the distribution list data to survey results you should ensure that you are complying with local data protection laws.
Add/Update records
New data can be loaded to update the distribution list. For example to add a new set of respondents, add a new variable for existing respondent or change value(s) for existing respondents (for example to update an email address).
When a new file is uploaded SCROLL will merge the new data with the existing data. SCROLL will prompt for column(s) (e.g. serial_number,email) to be used to link the new data to the existing data using the following rules:
- Records that match on the link variable will be updated with the new data
- Records that don't match on the link variable will be added as new records.
- New columns will be added to the data table for variable names in the new file which are different to the existing names.
Copy from a SCROLL Data project:
Use to open a screen with a drop down menu from which an existing SCROLL data file can be copied into the current project.
Use to confirm the selection and add the data.
Generate tokens
SCROLL tokens are used to track respondents so that reminder emails can be sent and returned questionnnaires linked to individuals in the distribution list.
Tokens are stored in a field called 'CW_token' and added to the survey URL to be used by respondents to access the questionnaire. Tokens are either generated automatically by SCROLL or taken from a field with the same name in your uploaded file and must be unique for each respondent.
SCROLL's emailing system will generate tokens automatically if tracking is required. If you are using your own systems to send out email invitations and you wish to track respondents then SCROLL can generate the tokens to be included in the URL links to the questionnaire.
To generate tokens use the button. This will open the Generate Tokens screen where you can generate random respondent tokens which can be downloaded and used in your own emailing campaign.
Enter the number of tokens to be generated and select the button. You can generate up to 50,000 tokens at a time.
The URL link to be sent to a respondent needs to have ?token={CW_token} at the end of the URL where {CW_token} is the unique token generated for that respondent.
Examples based on project MyProject in account MyAccount.
Testing URL:
https://scroll.infotap.uk/s/MyAccount/MyProject?token=jvUAA9vX6C23vNJhbKBM9A
Live URL:
https://scroll.infotap.uk/testing/MyAccount/MyProject?token=kBvzpI2N1EvxDFpDHpNFNA
Manage variables
Data uploaded from Excel or csv files will contain data values and variable names.
Fuller descriptions of the variables can be added in the Manage variables section. For example to add text descriptions and/or to define whether the data values should be treated as text or numbers or as codes for a categorical variable such as Gender which has associated label text (e.g. Male, Female)
The Manage variables screen presents the variables in a table with one row for each variable.
The column headings are:
- Linked: Use the checkboxes to indicate which variables should be included in the survey results file. When linking the distribution list data to survey results you should ensure that you are complying with local data protection laws.
- Variable name - taken from the first row of the uploaded distribution list.
- Question text - this will default to the Variable name if no text defined.
- Response type - this will default to Text(single-line) if no type defined.
- Mandatory - this will usually be empty
- Actions - to edit the variable definition
Select a variable name or to edit the properties of a variable. This will display the edit variable screen.
Click here for notes on how to assign variable types and add other properties to describe variables.
Advanced options:
Advanced users can enter variable definitions using the CAWI scripting language in a text file called a DSC file.
SCROLL will extract question definitions that match the names of variables in the imported data.
Select Browse at the bottom of the Manage variables screen, locate the DSC file and use the Upload button to import the DSC variable definitions.
The current description can also be downloaded as a DSC file
Define a Filter
Filters can be defined to select subsets of the respondents. For example to divide the list of potential respondents into groups to be emailed at different times.
Use to open the Filter definition/edit screen.
If filters already exists then the Name drop down menu can be used to select an existing filter to modify.
To define a new filter the Name box should be set to No filter selected
Select
This will open a drop down menu which can be used to build up an expression for a filter. For example, to define a filter to select men:
- select variable gender
- select Operator then the Equals operator
- Type male over the Enter value here placeholder text
- Select to confirm the filter as gender Equals male
Use to save the filter. This will present a window in which a Filter name and Filter description can be entered and saved.
Finally use to return to the Manage data screen.
The new filter will now be available to select from the box above the data table. If selected the data table will only display the records selected by the filter.
can be used to reopen the filter edit screen to modify the filter.
can be used to delete the filter.
Deploy options
This section is available at the bottom of the dashboard section of your survey.git
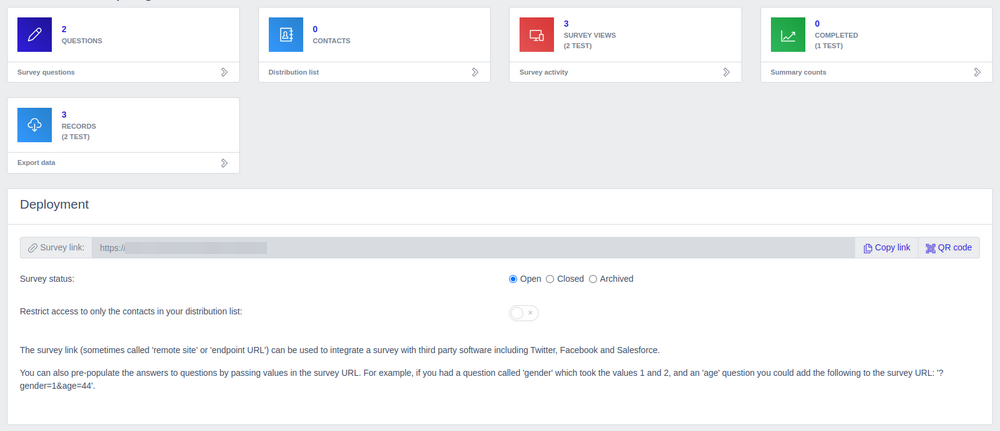
In this section you can choose 2 things:
- The status you want to give to your survey : Open / Closed / Archived
- The access restriction : you can choose to restrict the access to the survey only to the contact of your distribution list or to anyone who has the link.
Emailing
This is the area for managing email campaigns. A project may have multiple campaigns, for example to email invitations to different groups of respondents at different times. All the campaigns are listed on the Email campaigns page as described in Manage campaigns below.
Create a new campaign
Use to create a new email campaign. Note a distribution list must be loaded before an emails campaign can be set up.
This will open up the New campaign page where there are three main sections to define the campaign.
- Campaign options
- Campaign recipients
- Email content
Campaign name A name, for example Wave 1, that will be displayed on the Manage campaigns page.
Track survey responses
- Yes - the emailed link to the survey will contain a unique identifier that will enable interview data to be linked to the email address. Respondents will be able to use the link to re-enter partially completed questionnaires.
- No - responses will be anonymous (unless other identifying information included from the distribution list using the Linked setting in Manage variables)
Send emailing at
- - set the date the emails should be send using a calendar window.
- - set the time for the emails to be sent with 24 hour clock numbers.
- Use to set to current date and time. Sending the emails is initiated on the Manage campaigns screen as described below. Use Set to now if the emails are to be sent as soon as the set up finished and the campaign start button pressed in Manage campaigns.
Use this field as recipient address - a drop down box from which one of the variables in the distribution list can be selected. Select the variable containing the email address.
Campaign recipients
This is where the people to be emailed are selected from the distribution list. This maybe for a first emailing to some participants or for reminder emails to be sent to those yet to complete the survey or a thank you email to those who have completed the survey.
There are two ways selection can be done:
- Step 1 - Select using a filter defined in the distribution list. If filters have been created then the desired filter can be selected from a drop down list. For example to select participants for the first wave of a multi-wave survey.
- Step 2 - Select by previous contact and/or participation as described below.
For the first email campaign where all people in the distribution list are to be contacted just select:
All who have not yet been contacted about this survey
The full list of options for selection at Step 2 are listed below.
- All (filtered) recipients
- All who have not yet been contacted about this survey
- All who have not yet participated in this survey
- All who have accessed but not started this survey
- All who have started but not yet completed this survey
From the people who have already completed the survey:
- Those who successfully completed the survey
- Those who failed quota checks (Quotafull)
- Those who were screened out (Screenout)
As selections are made the Number of recipients selected will be displayed.
Use to download the distribution list data for the people selected.
Email content
This is where the actual email sender details and content are defined. Enter the information below:
- Subject Text to be displayed in the subject line of the email.
- From: (name) The name to be displayed to recipients to show who the email is from.
- From: (email address) The sender email address to be displayed to recipients.
Note that many email servers now check for suspicious emails. Emails generated from SCROLL but with your own email address may be rejected by some email servers. If in doubt then the email address noreply@sda-ltd.com can be used.
Next enter the text of the email. Two options are available for entering text.
- HTML version - provides a full range of formatting options - bold, font size, italic, underline, bullet lists, colour etc etc. The underlying HTML code generated can be viewed by choosing Source code from the Tools menu.
- Raw text version - a simple text editor
Both editors support the usual cut, copy and paste features.
Other Features:
Select the template you want to use:
There is a drop menu from which any available email templates can be selected to help with creating the email content.
Select the tags you want to insert in the email:
The content of any variables in the distribution list can be used to customise the email text. For example if title and surname are recorded in the distribution list then these can be substituted into the email text so that it could be begin with, for example, Dear Mr Ali
IMPORTANT: If sending out a link to the survey then remember to include - survey - from the tags drop down menu. This will display the link to the survey as survey.
So for example your email could contain: To start the survey please click here: survey.
The text survey can be altered by editing the link. (Right click if using a mouse).
To check that the email displays correctly a test email can be sent to yourself or a colleague. Click on the area shown below and box will open into which the email address to be sent the test can entered.
Test sending
Finally use to save your email definitions and return to the Email campaigns page to start the campaign.
Manage campaigns
The Email campaigns page lists all the campaigns have been set up. Once a campaign has been created it can be started by selecting in the last column for that campaign.
The last column lists all the actions available for each campaign as listed below:
- to open the edit campaign screen. See New Campaign described above.
- to start the campaign at the set date and time.
- to stop the campaign (only displayed for started campaigns).
- to delete the campaign.
- to make a copy of the campaign.
Information displayed for each campaign:
- Campaign - displays the name given when setting up the campaign
- Options - displays the options set for the campaign. For example Test survey (with tracking)
- Emailing status - whether the campaign has started or been stopped.
- Creation date - the date the campaign was set up and saved.
- Sending date - the date emails were sent.
- Emails sent - the number of emails sent.
The table listing all the campaigns can be sorted on all of the above columns.
SURVEY RESULTS: Check, Analyse and Export the data
Menu items - select menu item for detailed notes.
- Summary counts - display the results of the survey (frequency and % for all questions)
- Survey activity - monitor connections to the survey
- Connection statistics - display the number of interviewees that has validated the page regardless the date (detail per day available)
- Browse responses - list every response to the survey
- Cross tabulation - create summary tables from the survey responses
- Saved tables - display tables created in the cross tabulation section
- Export data - export the survey data for analysis in other systems
- Import data - import data into the project (Experimental feature in development)
Summary counts
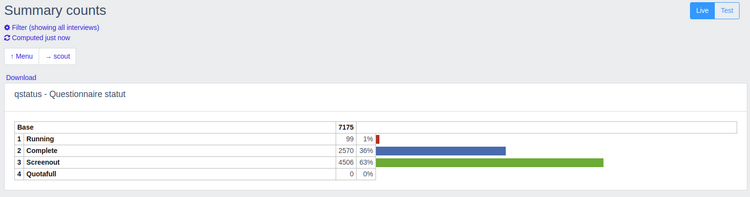
The Summary counts screen displays response summaries as below:
- List of choices questions - frequencies, percentages and bar charts (see example above).
- Numeric questions - minimum, maximum and average values.
- Text questions - display all the responses by selecting Show verbatims
Select Computed just now to ensure reports updated with latest responses.
The response summary can be filtered to only include respondents who gave a particular answer or answers.
Select Filter (showing all interviews) to enter a filter.
A pop up window will appear showing all the questions that can be used to define the filter. By default they will have All (no filter) selected.
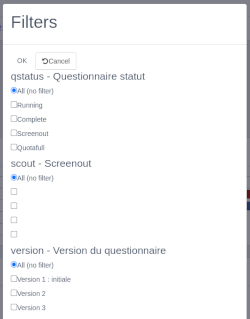
Select the categories to be used to filter the report then scroll to the top or bottom of the popup window and press or
If a filter is defined the report will be updated based on the filter and the text Filter (showing all interviews) will display the current filter.
For example: Filters: Questionnaire statut (qstatus=Complete), Version du questionnaire(version=1)
To show all respondents set All (no filter) for all questions in the filter pop up window.
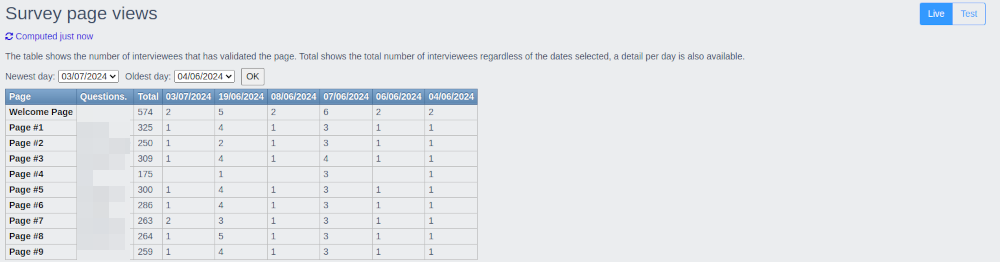
Survey activity
The Survey activity screen displays a table that can show the numbers of people who have connected to the survey in any time period from when the survey started. This is particularly useful for deciding if and when reminder emails should be sent out.
The period to be displayed can be selected using two dropdown menus:
- Newest day: the most recent date to be displayed.
- Oldest day: the earliest date to be displayed.
The table also shows the numbers of people who have validated each page of the survey (e.g Next or equivalent button selected to go to next page). This information can help to identify questions where respondents exit the questionnaire without completing it.
Note that if the survey has a Previous or equivalent page that allows respondents to go back to previous pages then the count against each question does not indicate the actual numbers answering that question because the page containing the question may have been validated more than once.
Connection statistics
The Connection statistics table counts the number of interviewees that has validated each page. You have the counts regardless of the date. But you can also choose a specific period.
Quota report
Display the quota report. See Survey quotas for an introduction to quotas.
Example quota report with 3 quota groups defined:
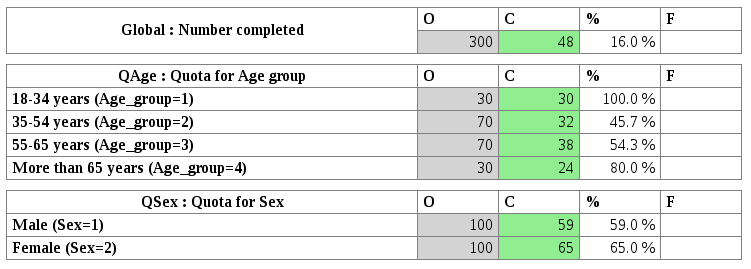
- O - the target number of interviews to be obtained
- C - the number of completed interviews achieved
- % - C as a percentage of O
- F - Number achieved after quota full (optional feature)
Browse responses
Displays a table listing all the respondents to the survey, including both those by people who have accessed the survey anonymously by following the survey link (when "Anonymous access" is enabled via Deploy options) and those who have been sent a tracked email link.
There are separate tables of responses in the development and live zones, showing accesses to the test and live versions of the survey respectively.
The table contains the following columns:
- Serial - the unique serial number given to this response.
- Type - how the respondent accessed the survey (anonymously or via a tracked email link.
- Survey started - date/time of first access to the survey.
- Survey finished - date/time of viewing the "thank you" page of the survey (if the respondent has reached that page).
- Status - status of the survey response. Examples: complete, started, homepage.
- Survey PDF - a link to a PDF document containing the survey responses.
- Edit - go back into the questionnaire to inspect/make changes.
The table can be sorted on any of these columns using the icons.
Cross tabulation
Choose Crosstabulation from the menu to start analysing the data.
Click here for a description of the crosstabulation features in Scroll.
Saved tables
This is the place where you will find all the tables you created in the Crosstabulation section.
Export data
The Export data menu item can be used to open the Export survey results data screen to download the data set for use in other systems.
The following export formats are available in the dropdown menu:
- Excel workbook (xlsx)
- SPSS Statistics (sav)
- Delimited text (csv) - with options to choose value separator and character encoding system to be used.
- Quantum
- SCROLL Bundle - data and descriptions suitable for loading into another SCROLL project.
Options are available to control how variables with text values associated with the data values (list of choices/categorical questions) are exported. These options are only displayed when relevant to the type of export being done.
Type of values for 'List of choices' questions
Output labels    - use the label text in the output file
Output position  - use the order categories defined to generate the output value
Output values    - use the actual value in the data
Output style for List of choices (select many) selections
Separate output for each defined choice
Separate output for each selection
Auto separate
Combine all selections together
Import data (Experimental feature in development)
This page allows you to import data into the "Survey results" part of your project.
TEST SURVEY: Testing the questionnaire.
Use to test the latest version of the questionnaire.
This will start the survey. Each questionnaire page will have a Return to SCROLL button which can be used to return to the development environment.